
Graphs: Then and Now
July 28, 2021
My kid makes a mean graph. And by mean, I mean colorful. He’s been making graphs now for… well…. about eleven years? (I realize.. this is not a milestone one typically tracks).
I remember falling in love with his first graph (at least the first graph I can remember seeing), made in his 6th grade science class. It was a graphical representation — a colorful one at that — of what happens when one adds certain substances (in this case milk, baking soda, and salt) to a vessel of vinegar. In Spanish, no less.
This one always cracked me up, because it seemed like more sizzle than steak… like, that’s a lot of color, honey! (Though upon closer inspection.. it’s quite well done.)

Eleven years later, he’s still looking at liquids, now measuring their flow patterns. And he’s still doing it colorfully (this time in English).
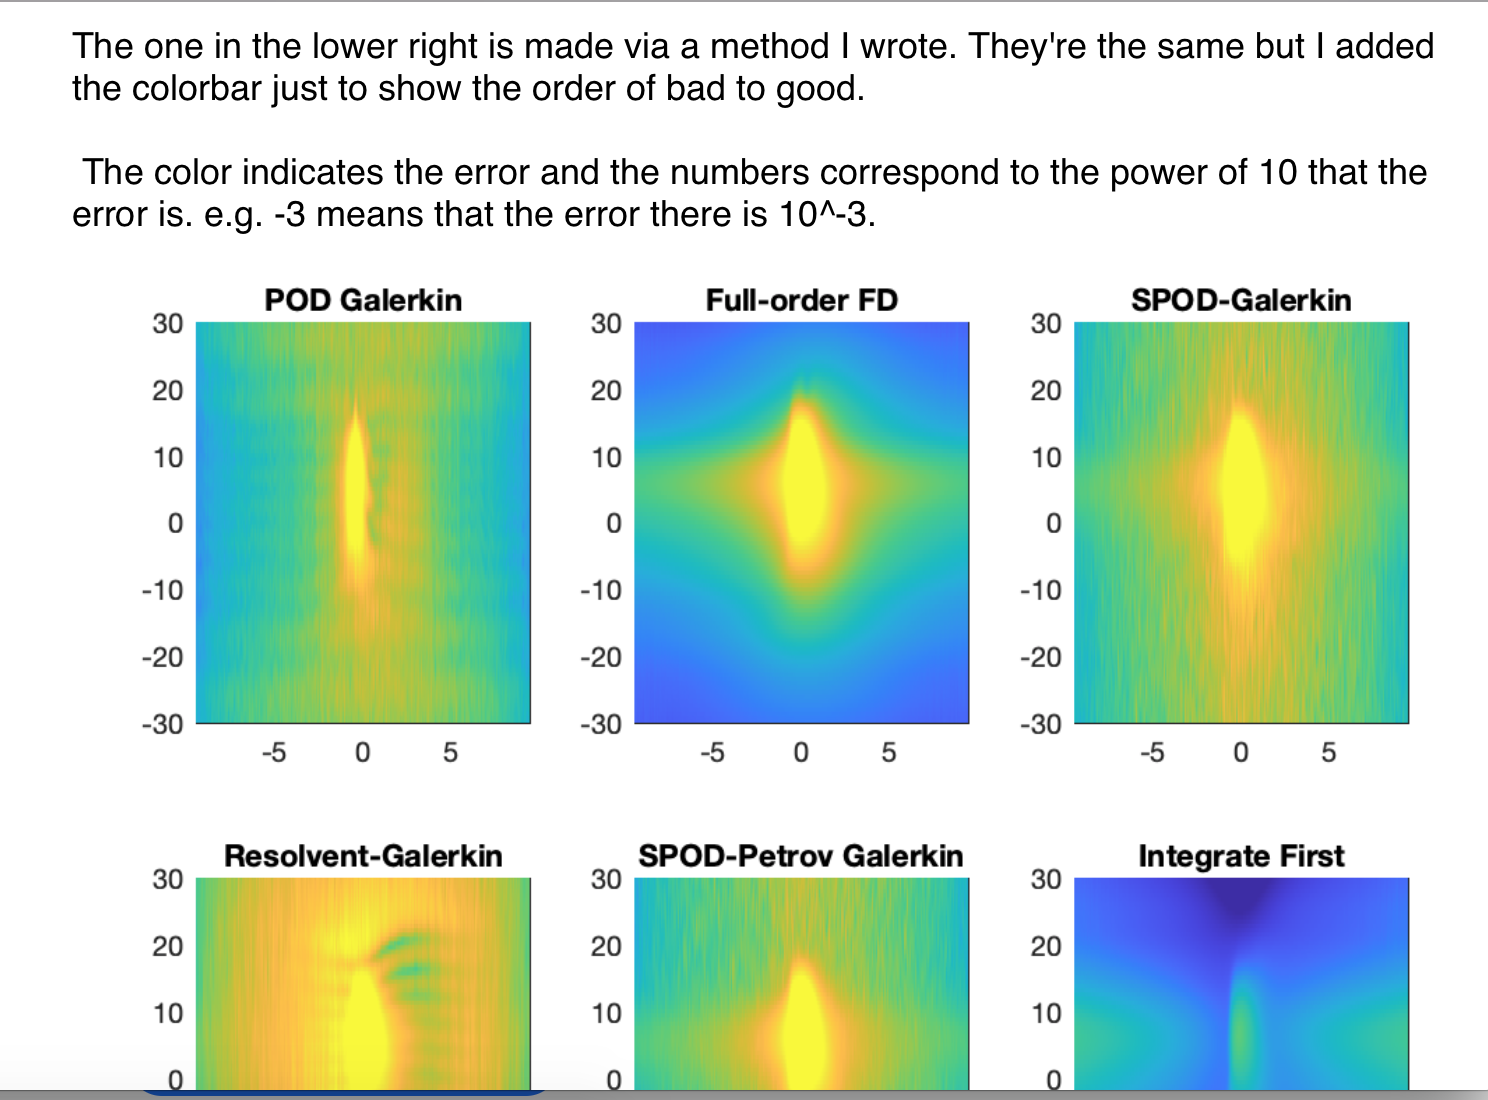


This time, even with closer inspection, I can’t begin to understand what’s going on here.
But I like his graphs.
